

We've released Piebald, the ultimate agentic AI developer experience.
Download it and try it out for free! https://piebald.ai/


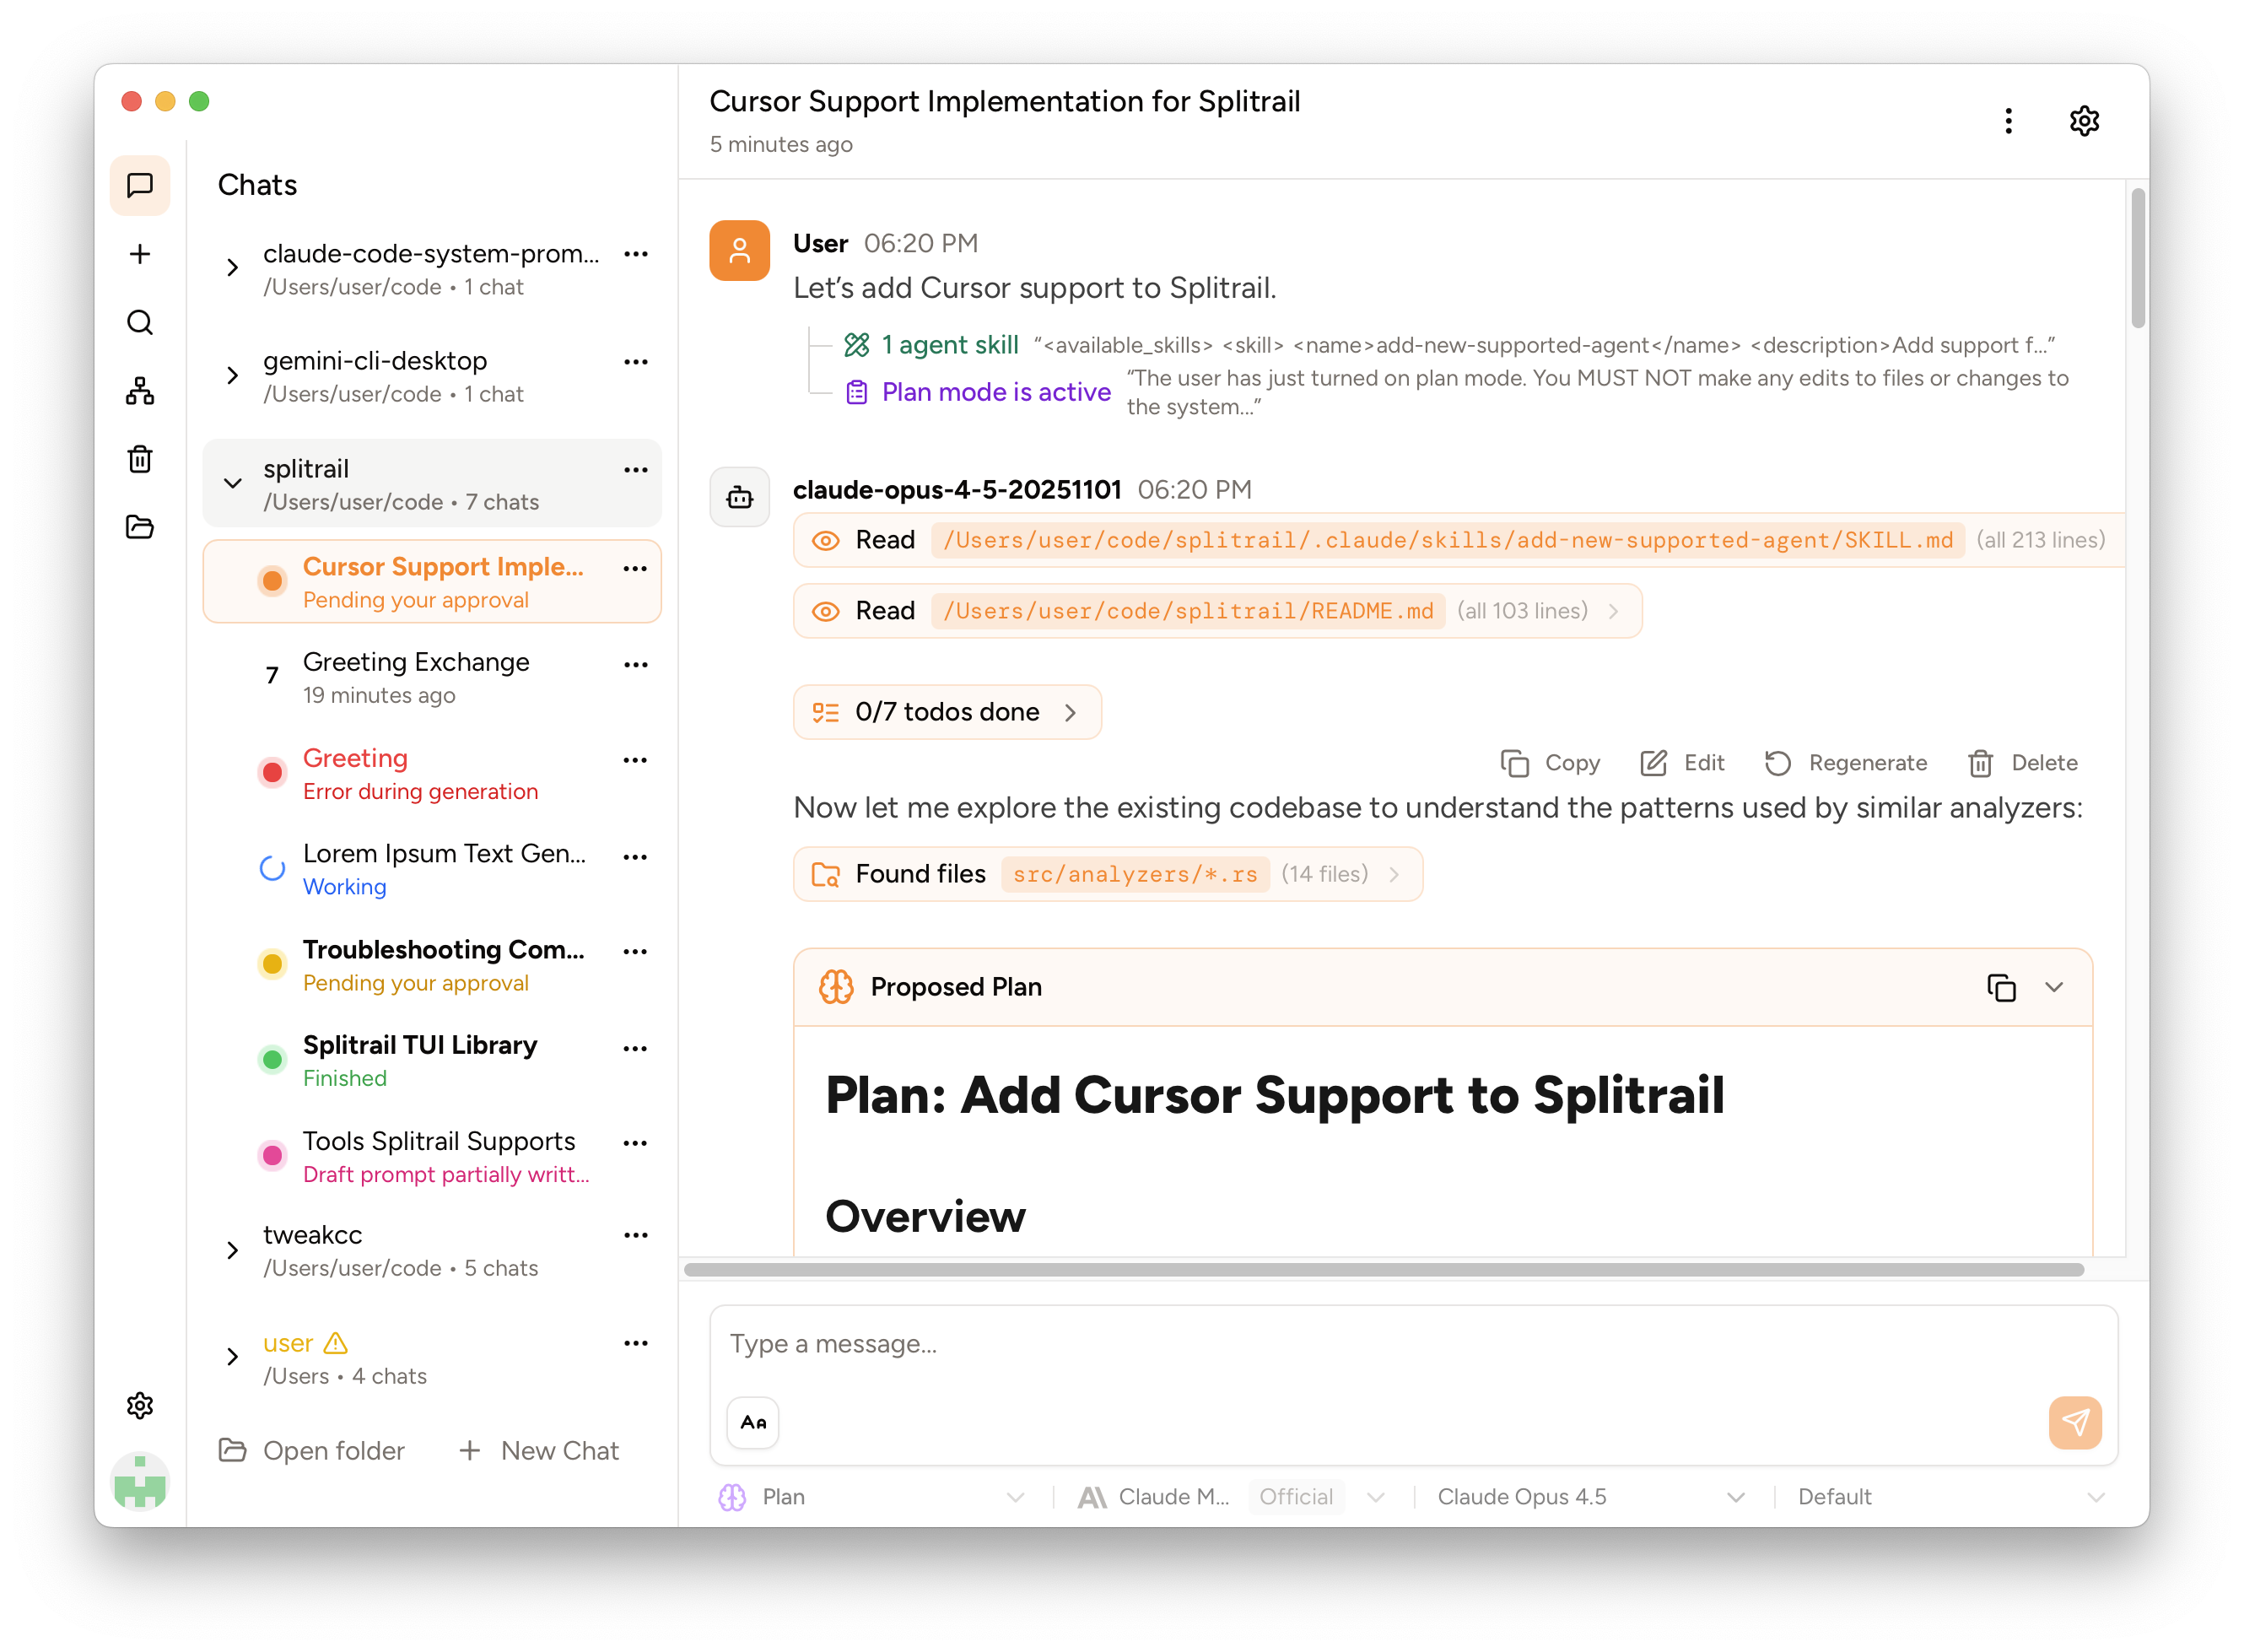
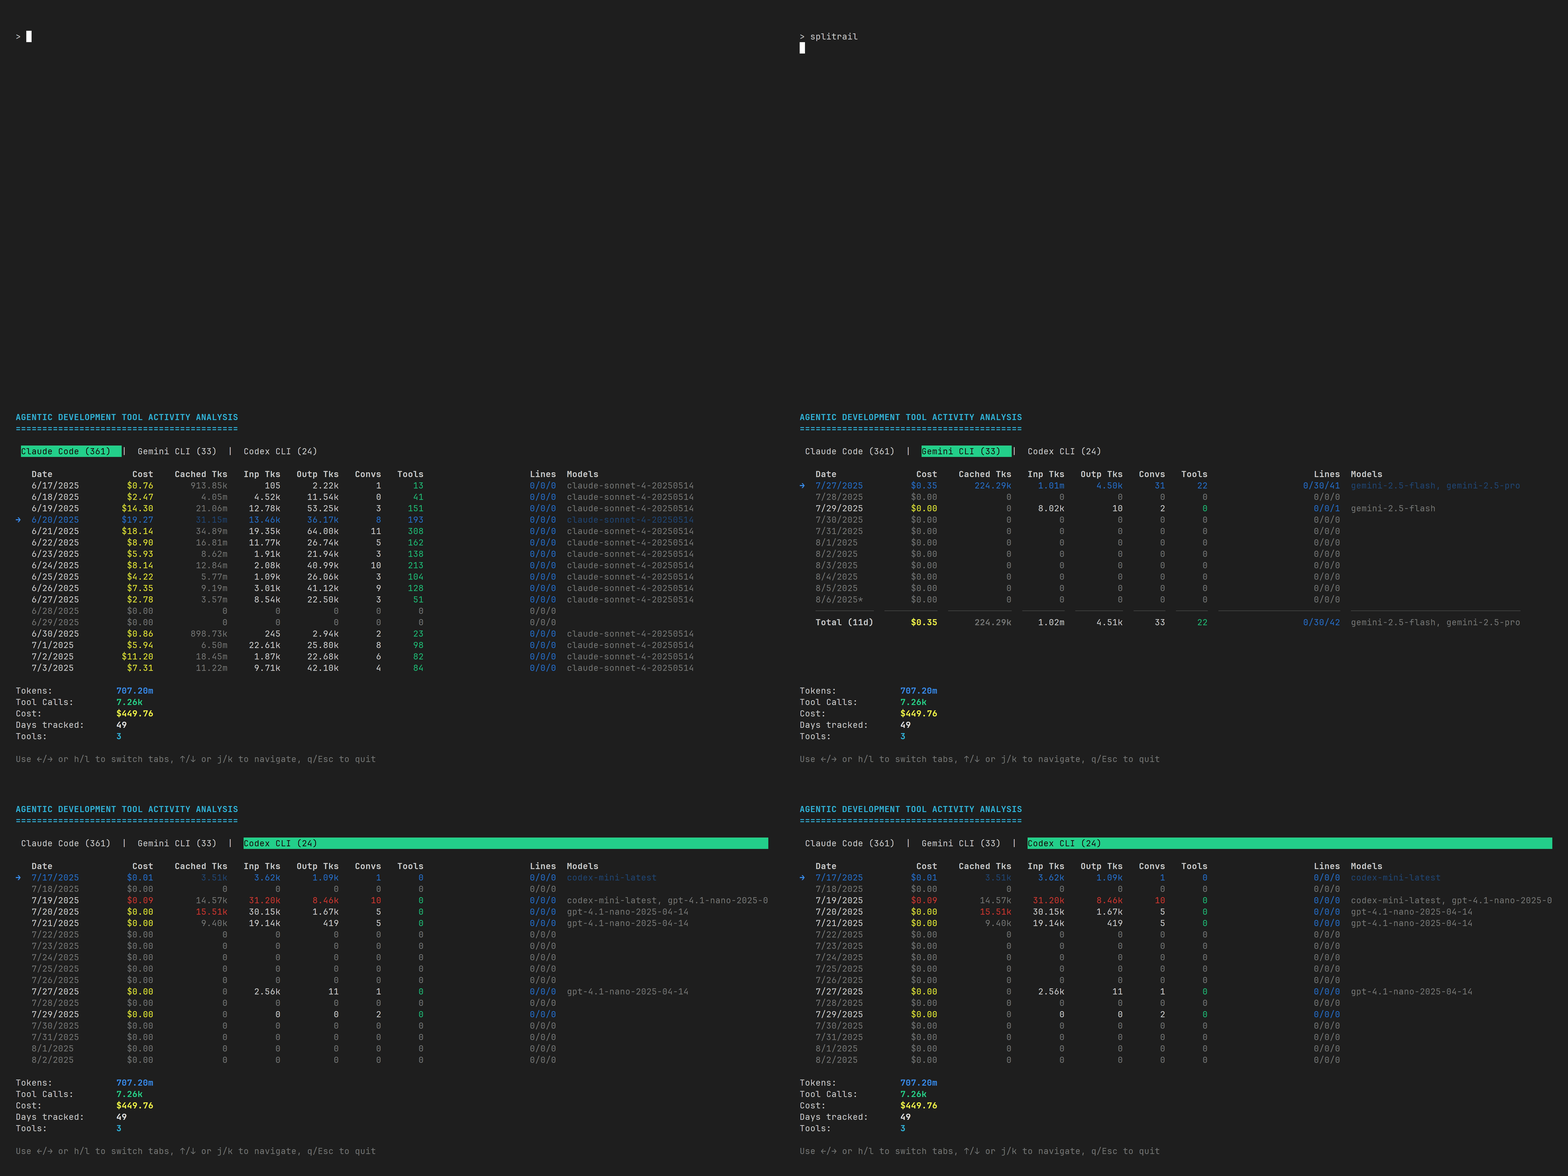
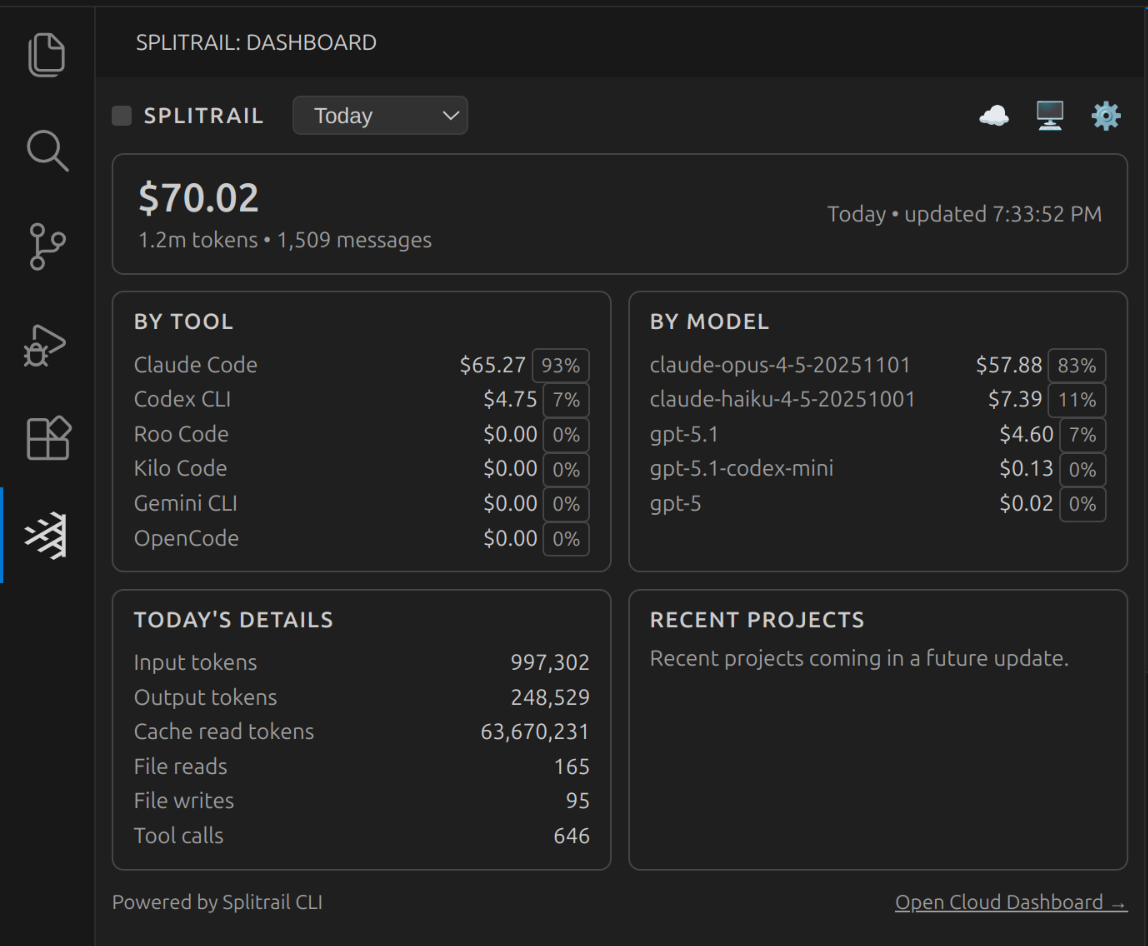
Splitrail is a fast, cross-platform, real-time token usage tracker and cost monitor for:
- Gemini CLI (and Qwen Code)
- Claude Code
- Codex CLI
- Cline / Roo Code / Zoo Code / Kilo Code (VS Code extension + CLI)
- GitHub Copilot (VS Code)
- GitHub Copilot CLI
- OpenCode
- Pi Agent
- Grok
- DeepSeek Harness
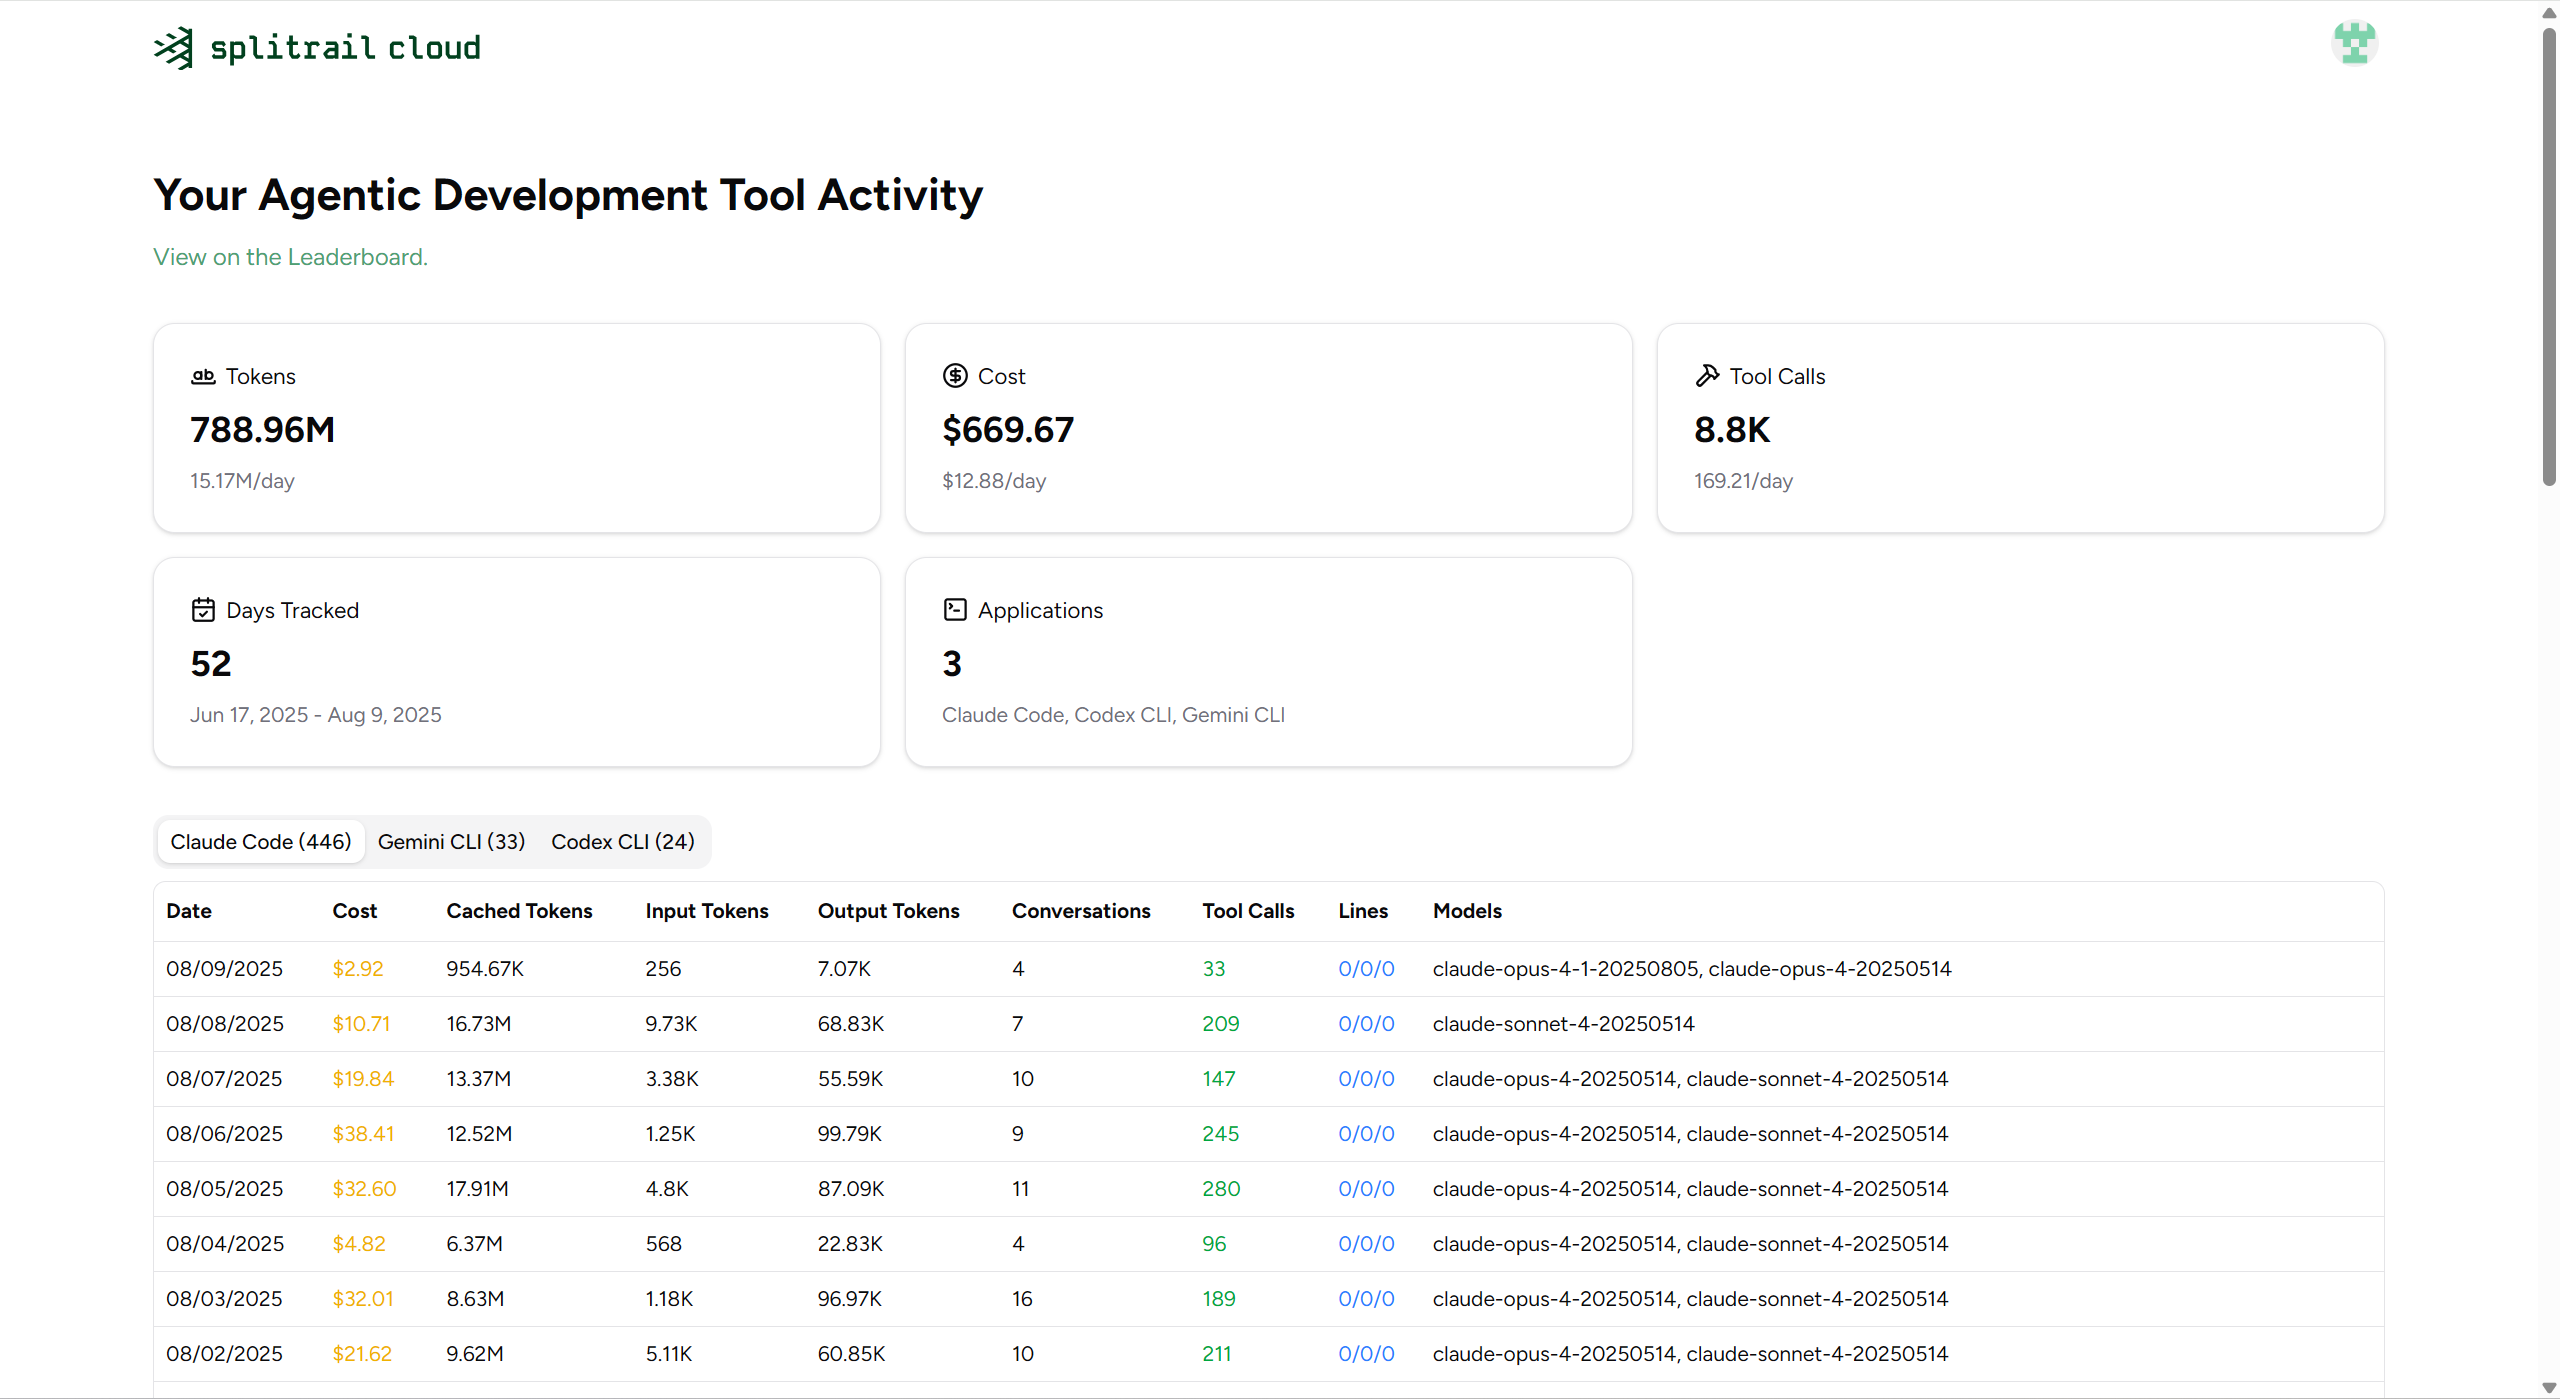
Run one command to instantly review all of your CLI coding agent usage. Upload your usage data to your private account on the Splitrail Cloud for safe-keeping and cross-machine usage aggregation. From the team behind  Piebald.
Note
⭐ If you find Splitrail useful, please consider starring the repository to show your support! ⭐
Download the binary for your platform on the Releases page.
Run splitrail web and open http://127.0.0.1:8765. Use splitrail web --port 9000 to choose another port. The server listens only on 127.0.0.1 and accepts that IP in the Host header. It reads local usage through the existing analyzers without uploading it. Static assets are embedded in the binary; no frontend build or Node installation is needed to run it.
The overview shows estimated cost, total tokens, session count, and cache share, with comparisons against the previous period. Filter by today, 7, 30, or 90 days, or all history, and select tools, models, or projects. Selections within one field combine; selections across fields narrow the result. Linked worktrees, repository subdirectories, and paths connected by an analyzer's project hash are grouped into one project. Hover a project to see its merged paths.
Switch between cost and tokens, and group the stacked trend by model, tool, or project. The chart supports hourly, daily, weekly, and monthly intervals; click a daily bar to inspect that day by hour. Focus the chart and use the arrow keys to read values, or Enter to drill into a day. Model, tool, and project rankings also filter on click. The five entities with the highest cost in the selected period keep their colors while filters change; the rest are grouped as Other.
Usage snapshots are saved in the system cache directory under splitrail/web-usage-v1.json. On restart, the page immediately shows the saved snapshot while a background scan refreshes it, then updates automatically. The first run without a valid cache waits for a scan. Click Refresh to scan again. Concurrent refreshes share one scan, cached pages remain available during scanning, and a failed refresh preserves the previous snapshot. Cache files with a different application version or timezone are ignored. Dates and hours use the machine's local time. Total tokens match the TUI: input + output + cached; reasoning tokens are not added again. Costs use public API prices and may differ from subscription spending.
Frontend aggregation tests run with node --test src/web/data.test.mjs.
The Sessions tab provides search, sorting by recency/cost/tokens/duration, and a paginated list. Select a session to see its whole-session totals, reply and tool-call counts, token mix, model usage, and hourly or daily timeline. Shared filters select sessions; the detail panel shows the entire selected session.
The Breakdown tab groups the filtered usage by period, project, model, or tool. Export CSV downloads the same groups, columns, ordering, and total row with exact numeric values. Shares are fractions between 0 and 1; text labels are escaped for spreadsheet use. View and filter selections are kept in the URL hash for bookmarks.
English is the default language; choose Simplified or Traditional Chinese in the header. The preference is saved locally. The dashboard follows the system's light/dark appearance and adapts to phone widths, with horizontally scrollable charts and tables. Overview also includes a weekday/hour activity heatmap and the largest sessions.
Splitrail can run as an MCP (Model Context Protocol) server, allowing AI assistants to query your usage statistics programmatically.
splitrail mcpget_daily_stats- Query usage statistics with date filteringget_model_usage- Analyze model usage distributionget_cost_breakdown- Get cost breakdown over a date rangeget_file_operations- Get file operation statisticscompare_tools- Compare usage across different AI coding toolslist_analyzers- List available analyzers
splitrail://summary- Daily summaries across all datessplitrail://models- Model usage breakdown
Splitrail stores its configuration at ~/.splitrail.toml:
[server]
url = "https://splitrail.dev"
api_token = "your-api-token"

[upload]
auto_upload = false
upload_today_only = false

[formatting]
number_comma = false
number_human = false
locale = "en"
decimal_places = 2

[logging]
level = "warn"On Windows, we use lld-link.exe from LLVM to significantly speed up compilation, so you'll need to install it to compile Splitrail. Example for winget:
winget install --id LLVM.LLVMThen add it to your system PATH:
:: Command prompt
setx /M PATH "%PATH%;C:\Program Files\LLVM\bin\"
set "PATH=%PATH%;C:\Program Files\LLVM\bin"
or
# PowerShell
setx /M PATH "$env:PATH;C:\Program Files\LLVM\bin\"
$env:PATH = "$env:PATH;C:\Program Files\LLVM\bin\"
Then use standard Cargo commands to build and run:
cargo runBuild as normal:
cargo run
Copyright © 2026 Piebald LLC.