

Performance Co-Pilot (PCP) provides a framework and services to support system-level performance monitoring and management. It presents a unifying abstraction for all of the performance data in a system, and many tools for interrogating, retrieving and processing that data.
This Grafana app plugin integrates PCP metrics into Grafana, bundling three datasources and premade dashboards for real-time monitoring, historical analysis, and eBPF tracing.
- Grafana >= 12.4.3
- Performance Co-Pilot (PCP) with
pmcdandpmproxyrunning on the monitored host(s)- PCP Vector and PCP bpftrace connect to
pmproxyfor real-time metrics
- PCP Vector and PCP bpftrace connect to
- Valkey (or Redis) with
pmloggerarchiving metrics andpmproxyconfigured to write to the key server for the PCP Valkey datasource - bpftrace installed on the monitored host for the PCP bpftrace datasource
- For full-text metric search:
pmproxywith[pmsearch] enabled = trueand a search index built bypmsearch_daily(1)(SQLite-backed; requires a PCP release that includes the reimplemented search backend)
-
Install the plugin from the Grafana plugin catalog or with the Grafana CLI:
grafana cli plugins install performancecopilot-pcp-app
-
Enable the app plugin in Grafana under Administration > Plugins > Performance Co-Pilot and click Enable.
-
Configure a datasource under Connections > Data sources > Add data source:
- PCP Vector — for real-time metrics from a single host. Set the URL to your
pmproxyinstance (default:http://localhost:44322). - PCP Valkey — for historical metrics stored in Valkey/Redis. Set the URL to your
pmproxyinstance. - PCP bpftrace — for eBPF tracing scripts. Set the URL to your
pmproxyinstance.
- PCP Vector — for real-time metrics from a single host. Set the URL to your
-
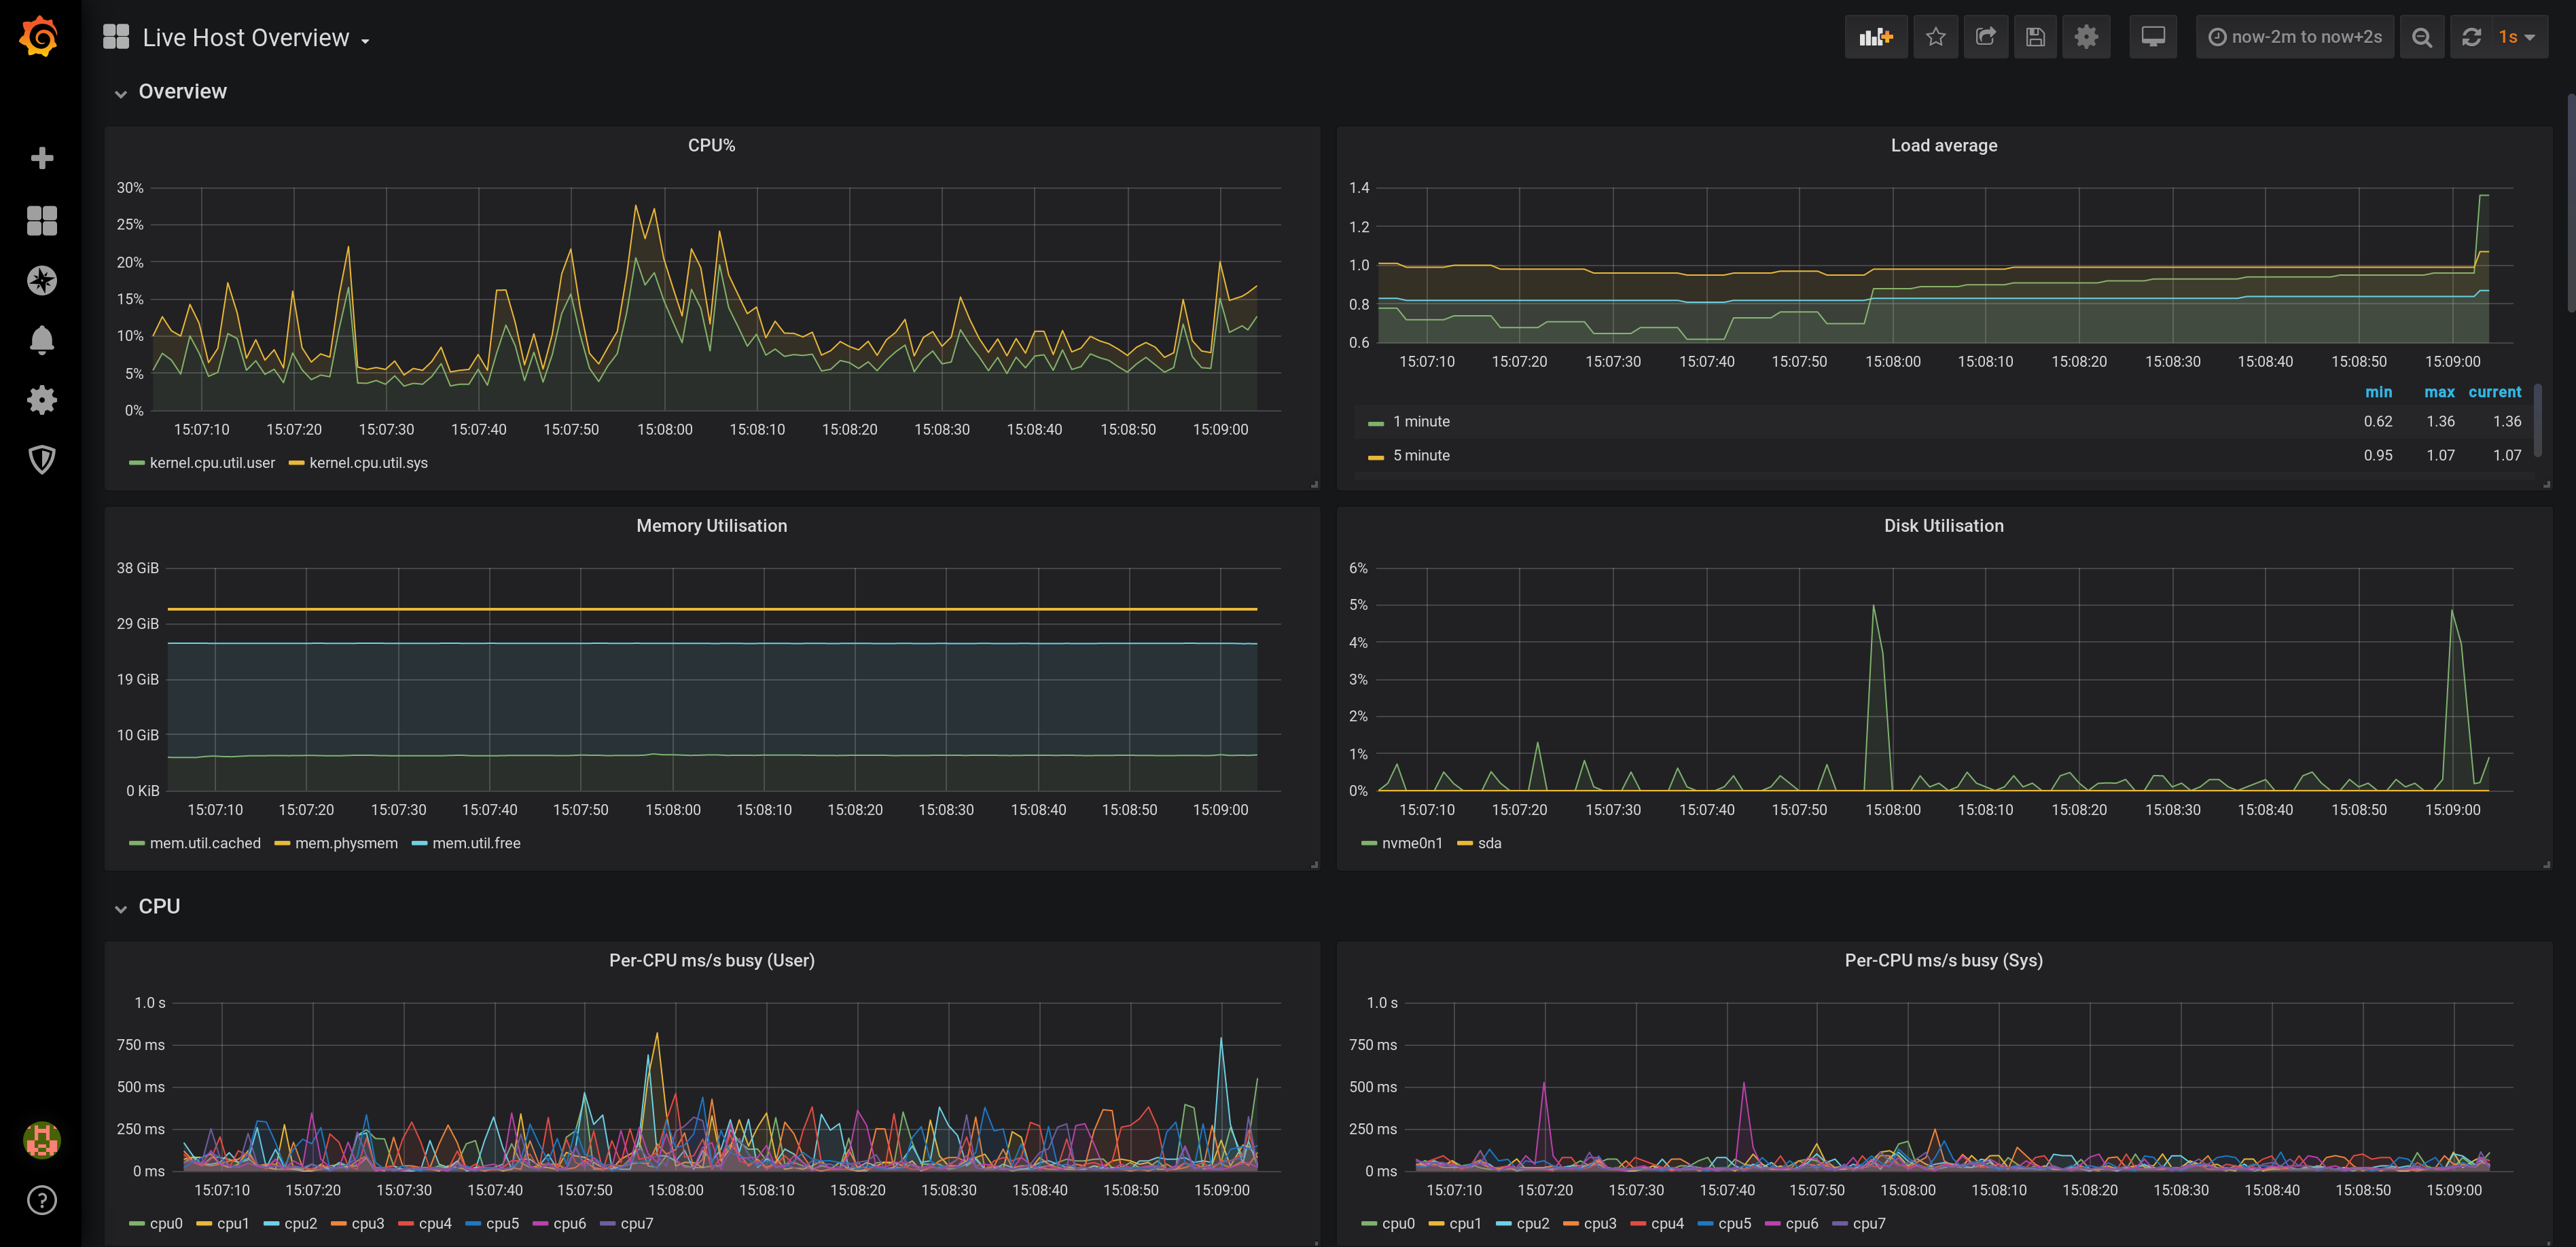
Import bundled dashboards from each datasource's settings page under the Dashboards tab. The PCP Vector Checklist dashboards use the USE method to detect potential performance issues.
PCP Redis was renamed to PCP Valkey in v5.2.0. If you are upgrading from the catalog's v5.0.0 release, or any installation still using PCP Redis, you must migrate existing PCP Redis datasources. The datasource type changed from performancecopilot-redis-datasource to performancecopilot-valkey-datasource.
Until migrated, these datasources cannot run queries, and alert rules using them fail with plugin not registered. Plan the upgrade and migration together to minimize the interruption to dashboards and alerting. PCP Vector and PCP bpftrace datasources do not need this migration.
Update each existing datasource in place, keeping its UID, URL and settings. Do not delete and recreate it: retaining the UID preserves references from dashboards and alert rules. Saved credentials are retained when updating the existing datasource without replacing its secure settings. This plugin migration does not require replacing a Redis server with Valkey.
Dashboard data source variables that filter by performancecopilot-redis-datasource no longer list migrated datasources. In each affected dashboard's variable settings, change the datasource type filter to PCP Valkey (performancecopilot-valkey-datasource).
As an administrator, open Administration > Plugins > Performance Co-Pilot > Config and click Migrate PCP Redis data sources. The action migrates the PCP Redis datasources returned by Grafana in the current organization and reports the result for each one. For organizations that exceed Grafana's datasource list limit, use the manual procedure below for any remaining datasources. Only read-only provisioned datasources are skipped. Editable provisioned datasources may be migrated by the action, but their YAML must also be updated as described below before restarting Grafana or reloading provisioning, or provisioning may restore the Redis type. After migration, check your dashboards and alert rules.
To migrate manually instead, follow these steps:
Use the Grafana datasource API with credentials that have permission to read and update the datasource.
- Retrieve the existing datasource configuration with
GET /api/datasources/uid/<uid>. Its UID is available in the datasource's Grafana settings URL, or by listing datasources withGET /api/datasources. - In the returned configuration, change
"type": "performancecopilot-redis-datasource"to"type": "performancecopilot-valkey-datasource". Keep the UID and all other settings unchanged. Do not add or replacesecureJsonData; Grafana retains the saved credentials. - Send the updated configuration as the JSON body of
PUT /api/datasources/uid/<uid>, using the same UID.
For example, using curl and jq, set the values below for your Grafana instance and existing PCP Redis datasource, then run:
GRAFANA_URL='http://localhost:3000'
GRAFANA_TOKEN='<service-account-token>'
DATASOURCE_UID='<existing-pcp-redis-uid>'

curl --fail --silent --show-error \
  -H "Authorization: Bearer $GRAFANA_TOKEN" \
  "$GRAFANA_URL/api/datasources/uid/$DATASOURCE_UID" \
  -o pcp-redis-datasource.json &&
jq '.type = "performancecopilot-valkey-datasource"' \
  pcp-redis-datasource.json > pcp-valkey-datasource.json &&
curl --fail --silent --show-error \
  -X PUT \
  -H "Authorization: Bearer $GRAFANA_TOKEN" \
  -H 'Content-Type: application/json' \
  --data-binary @pcp-valkey-datasource.json \
  "$GRAFANA_URL/api/datasources/uid/$DATASOURCE_UID"
Repeat for each PCP Redis datasource, then use Save & test in Grafana and check its dashboards and alert rules.
Read-only provisioned datasources cannot be migrated through the API. For all provisioned datasources, including editable ones already migrated using the action or API, update the provisioning YAML before restarting Grafana or reloading provisioning to prevent the Redis type from being restored.
- In the datasource's provisioning YAML, change
type: performancecopilot-redis-datasourcetotype: performancecopilot-valkey-datasource. Keep its UID and other settings unchanged. - If the configuration uses a
versionfield, increment it, then restart Grafana or reload datasource provisioning. - Verify the datasource, dashboards and alert rules.
- Analysis of historical PCP metrics using pmseries query language
- Analysis of real-time PCP metrics using pmwebapi live services
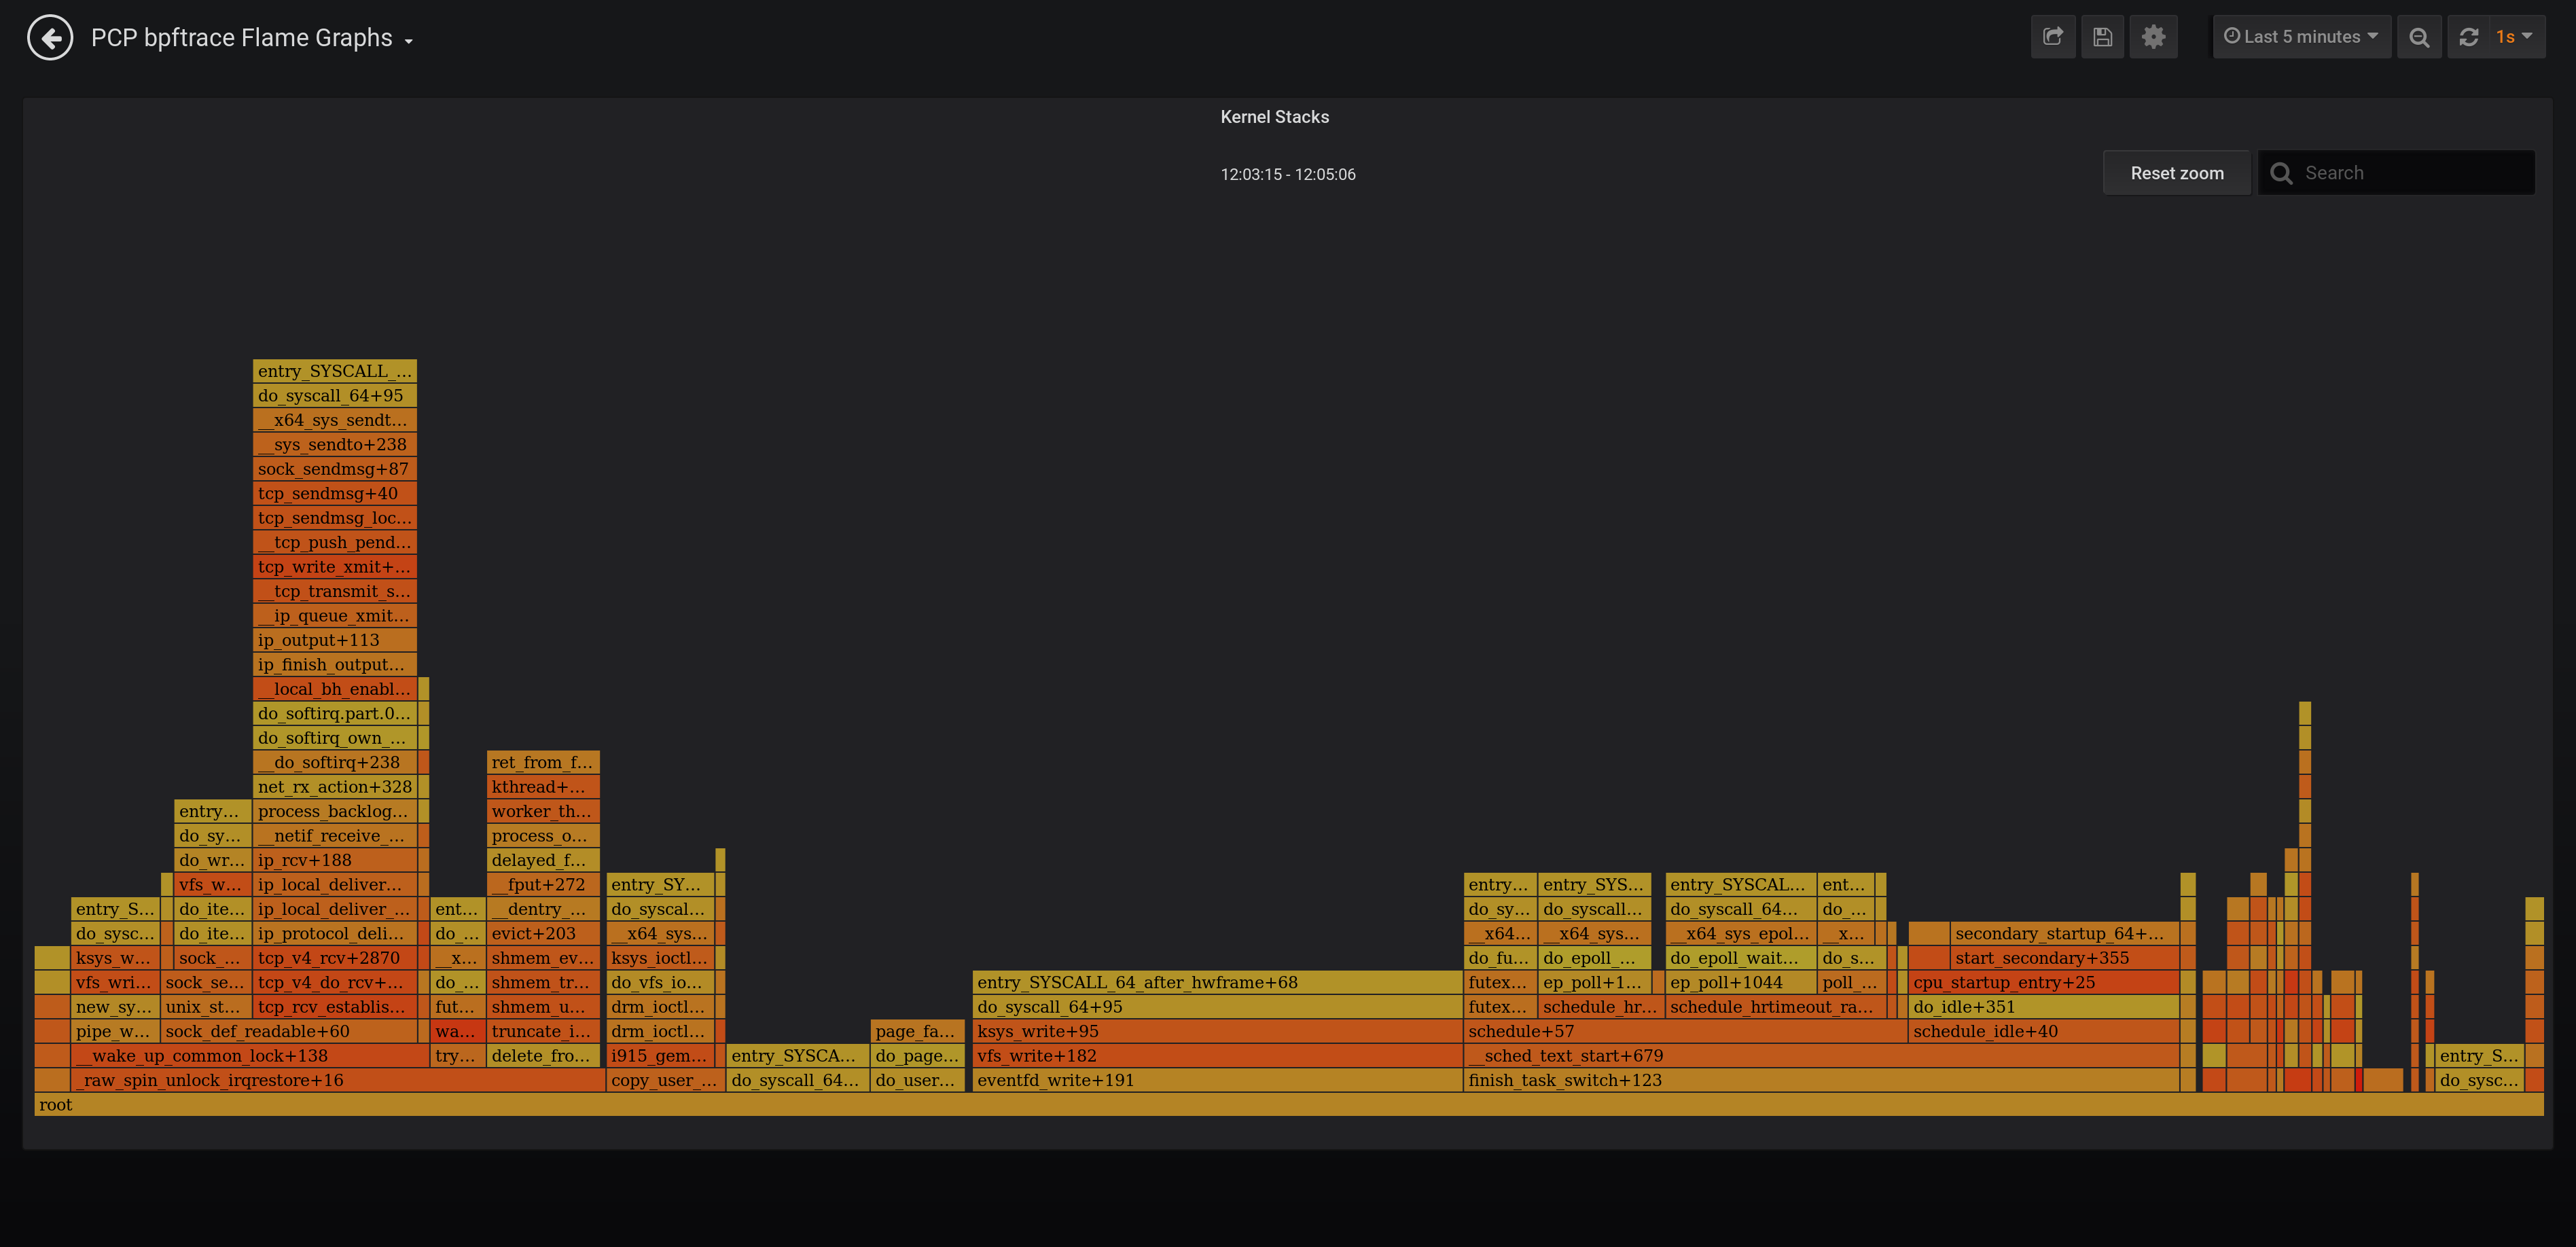
- Enhanced Berkeley Packet Filter (eBPF) tracing using bpftrace scripts
- Dashboards for detecting potential performance issues using the Utilization Saturation and Errors (USE) method [2]
- Full-text search in metric names, descriptions, instances [1]
- Support for Grafana Alerting [1]
- Support for derived metrics (arithmetic operators and statistical functions inside a query) [2]
- Automated configuration of metric units [1,2,3]
- Automatic rate and time utilization conversion
- Heatmap, table [2,3] and flame graph [3] support
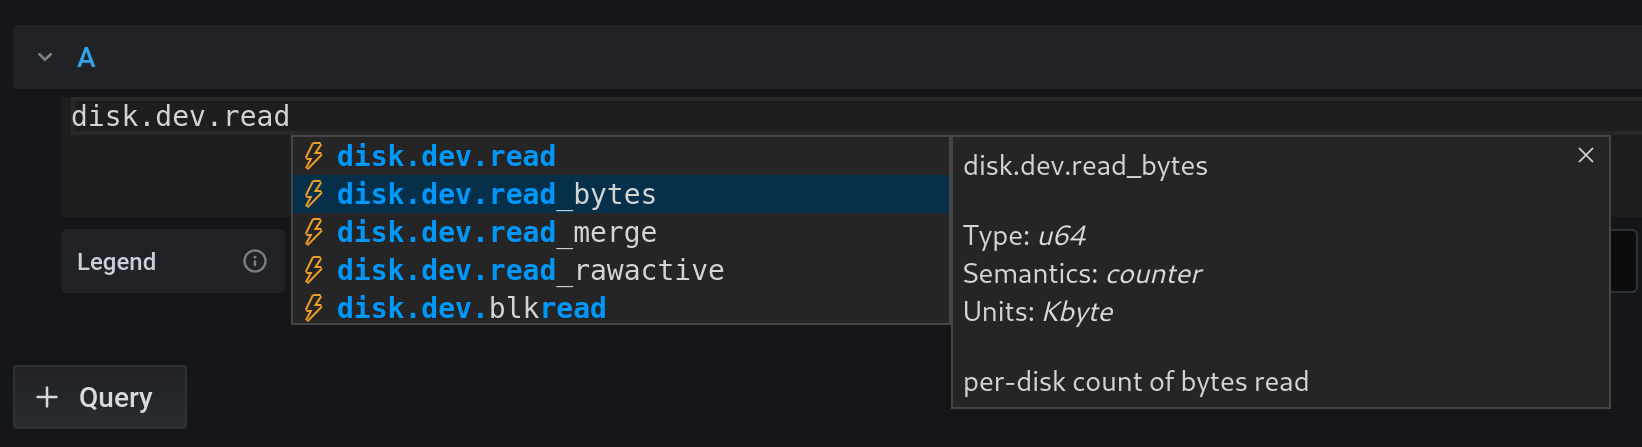
- Auto completion of metric names [1,2], qualifier keys and values [1], and bpftrace probes, builtin variables and functions [3]
- Display of semantics, units and help texts of metrics [2] and bpftrace builtins [3]
- Legend templating support with
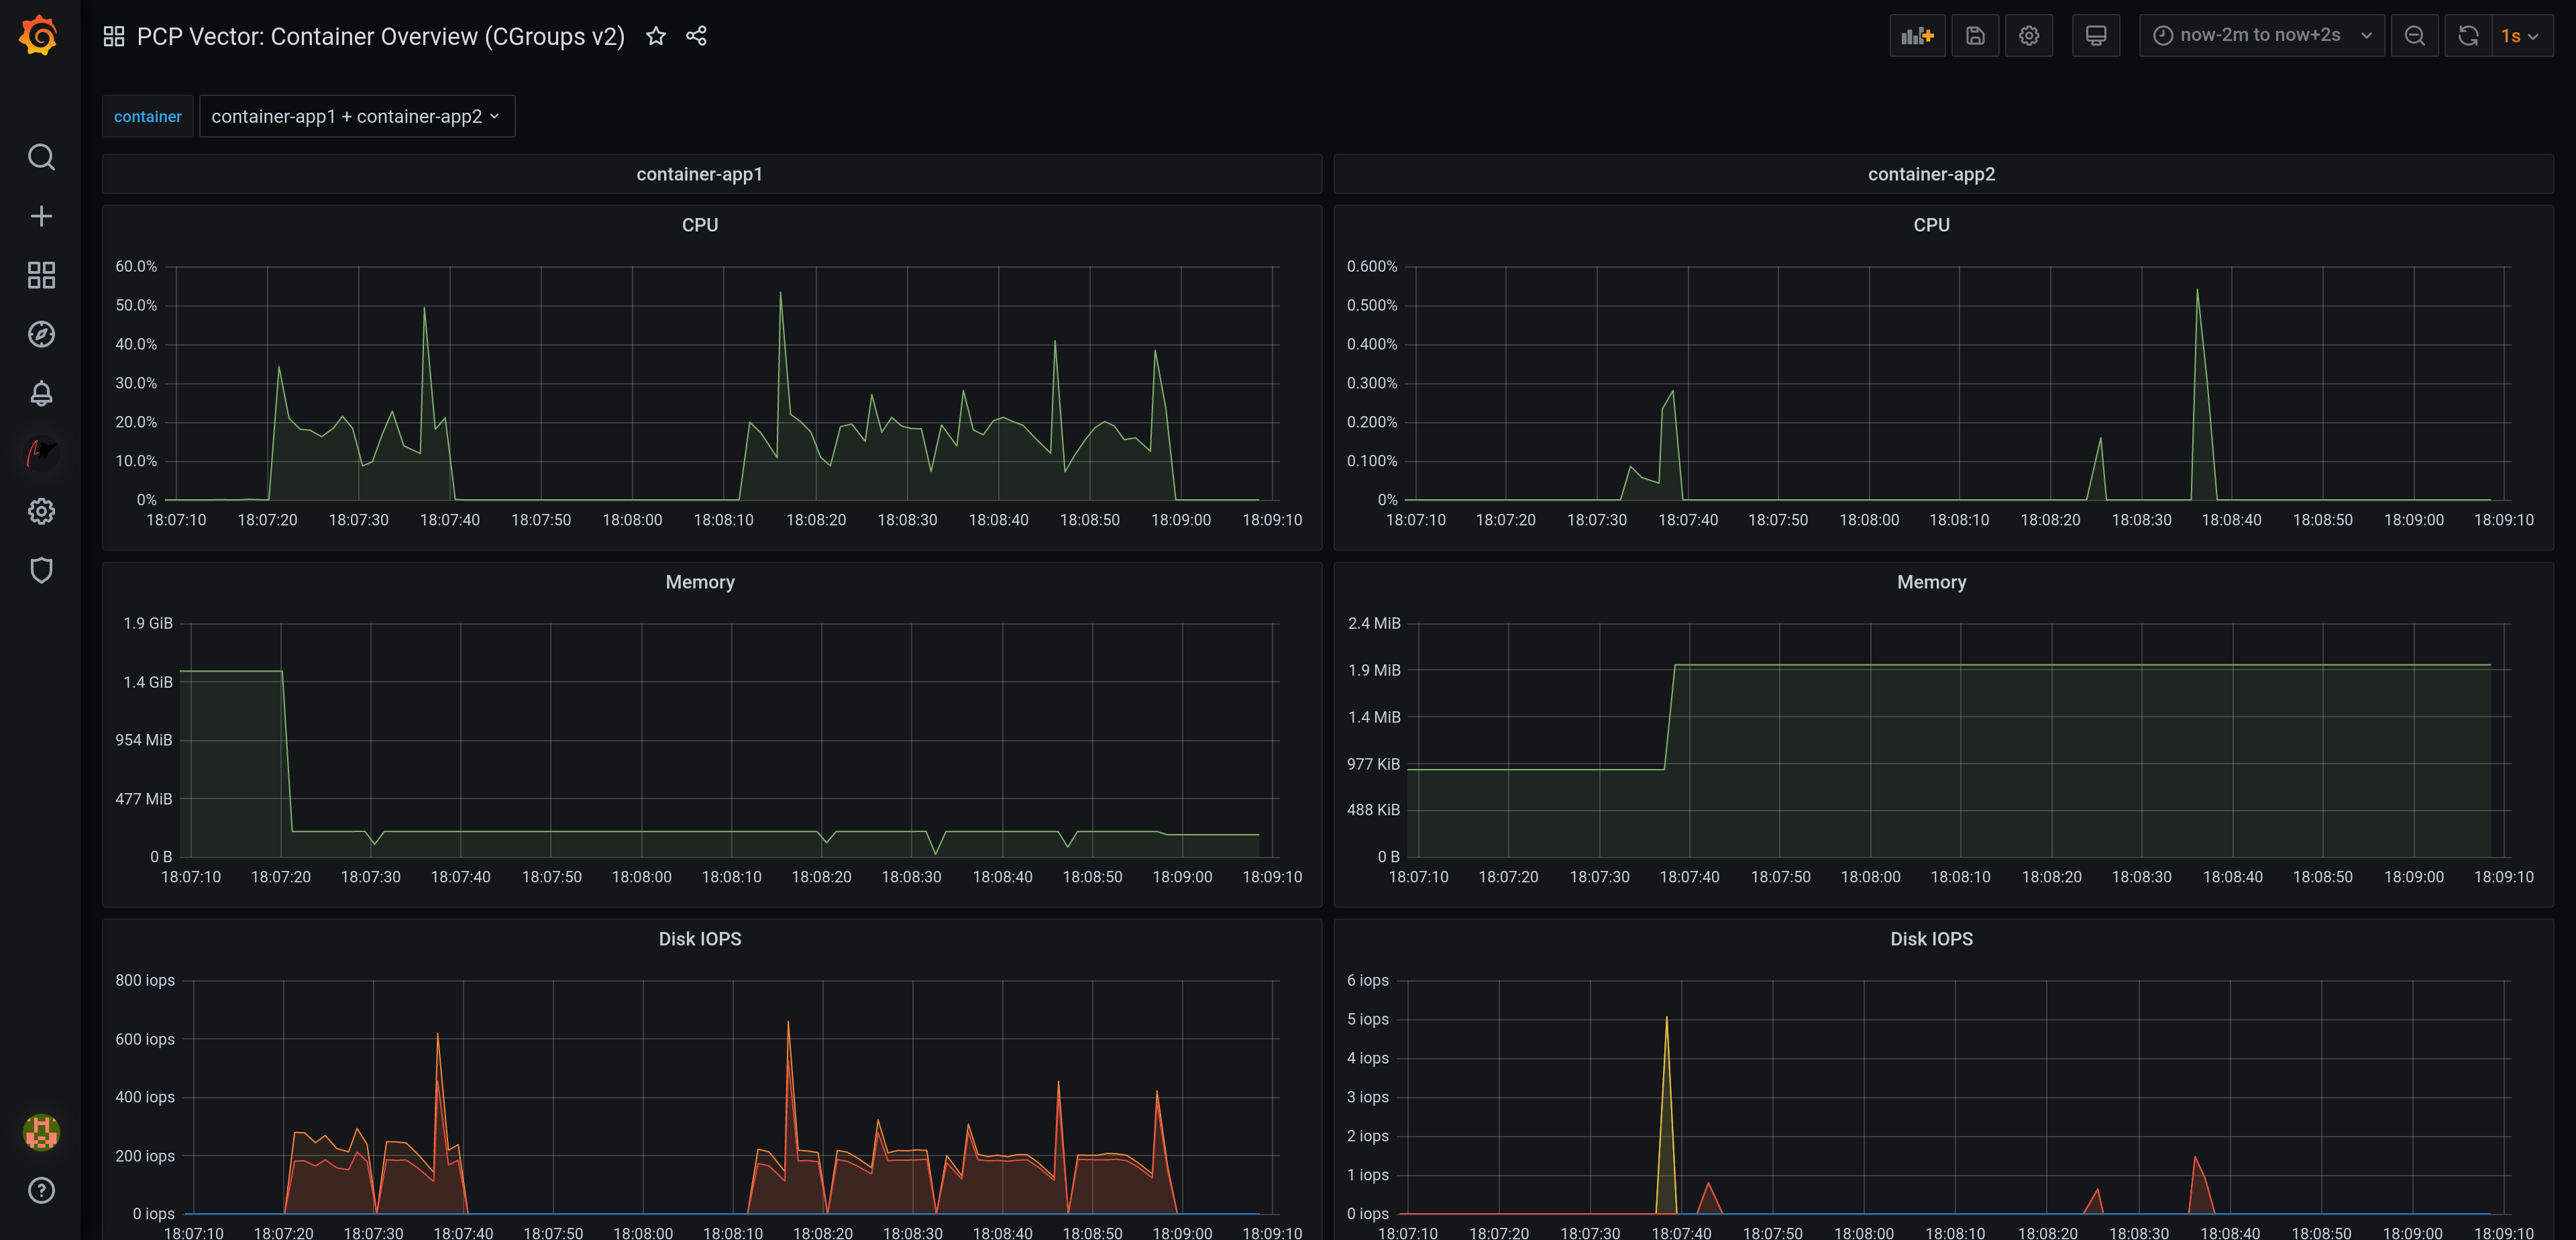
$metric,$metric0,$instance,$some_label,$some_dashboard_variable - Container support [1,2]
- Support for custom endpoint and hostspec per panel [2,3]
- Support for repeated panels
- Sample dashboards for all datasources
[1] PCP Valkey [2] PCP Vector [3] PCP bpftrace